
KPIs
Overview
As outcome-based marketing continues to prove itself an invaluable digital marketing channel, marketers are increasingly asking what they can do to optimize their campaigns and affiliate programs as a whole. By determining which KPIs best represent an affiliate campaign’s performance, marketers can understand which aspects of their program need optimizing and what those optimizations could look like.
These KPIs can now be tracked, analyzed, and optimized right in our platform!
How does it work?
We import your quality data, configure your preferred KPI into the system, and allow our proprietary platform to monitor the KPI performance. This performance can be quickly analyzed for optimization possibilities at the partner, source, subid, and traffic type levels.
Key Performance Indicators(KPIs)
Effective Cost Per Engagement(eCPE)
If your customers perform a valued action after the conversion, eCPE will give insight into how much you are spending per valued action.
- A pay per call campaign may convert when the user is on the call for 60 seconds, but the valued action happens minutes or days later when the user is sold the product. eCPE will report how much is spent per Sale.
- A cost per install campaign converts when the user installs the mobile app. A valued user action, such as Registration or Paid Start occurs after the user installs the application. eCPE will report how much is spent per Registration and/or Paid Start.
How do you calculate it?
Total amount spent / Total number of users who completed the engagement(i.e. event)
Return on Ad Spend(ROAS)
If the user spends money on your product, ROAS will tell you how much revenue you earned for every dollar spent on the campaign.
How do you calculate it?
Total amount made on sales / Total amount spent
Average Order Value(AOV)
If the user spends money on your product, AOV will tell you on average how much revenue you earn for every sale.
How do you calculate it?
Total amount made on sales / Number of conversions
Other KPI Metrics
- Cost per Action(CPA): the average amount spent for the main conversion. CPA = Total amount spent / Number of conversions. This can be great for revshare campaigns with different payouts or CPC campaigns.
- Event Rate(EVR): the percent of customers who complete the selected event after the conversion. EVR = Number of events / Number of Conversions. This is another way to look at eCPE.
- Conversion Rate(CVR): percent of clicks that convert to a conversion. CVR = Number of conversions / Number of Clicks.
How do I set this up?
Quality data can be sent to our proprietary platform in many different ways mentioned below. Common examples of quality data will be tracking an event that occurs after the paid conversion or tracking how much the consumer spent in sales(i.e. Sale Amount).
Quality Data Import Options
- Postback/Pixel Integration: This is the fastest, easiest, and most efficient way to share quality data in real time.
- Manual Events Adjustment: Executed by our internal team, events can be manually entered into our platform using an Events Adjustment tool.
- Excel File: A custom Excel ingestion service can be built if the only way to share the quality data is via a file. After our technical team builds this service, you and your growth manager will be provided with a specific email address. You can send your quality data Excel file to this email address at any time. Our proprietary platform will receive the file, automatically ingest the data, and display the results in your platform reporting. The file must include a linkid or clickid for the ingestion service to map the data properly. A unique subid can also be used to look up the linkid or clickid if needed.
Event & Sale Amount Setup in CAP
If the quality data being shared is an Event occurring after the main conversion, a new event will need to be set up on the Campaign. Follow the steps below.
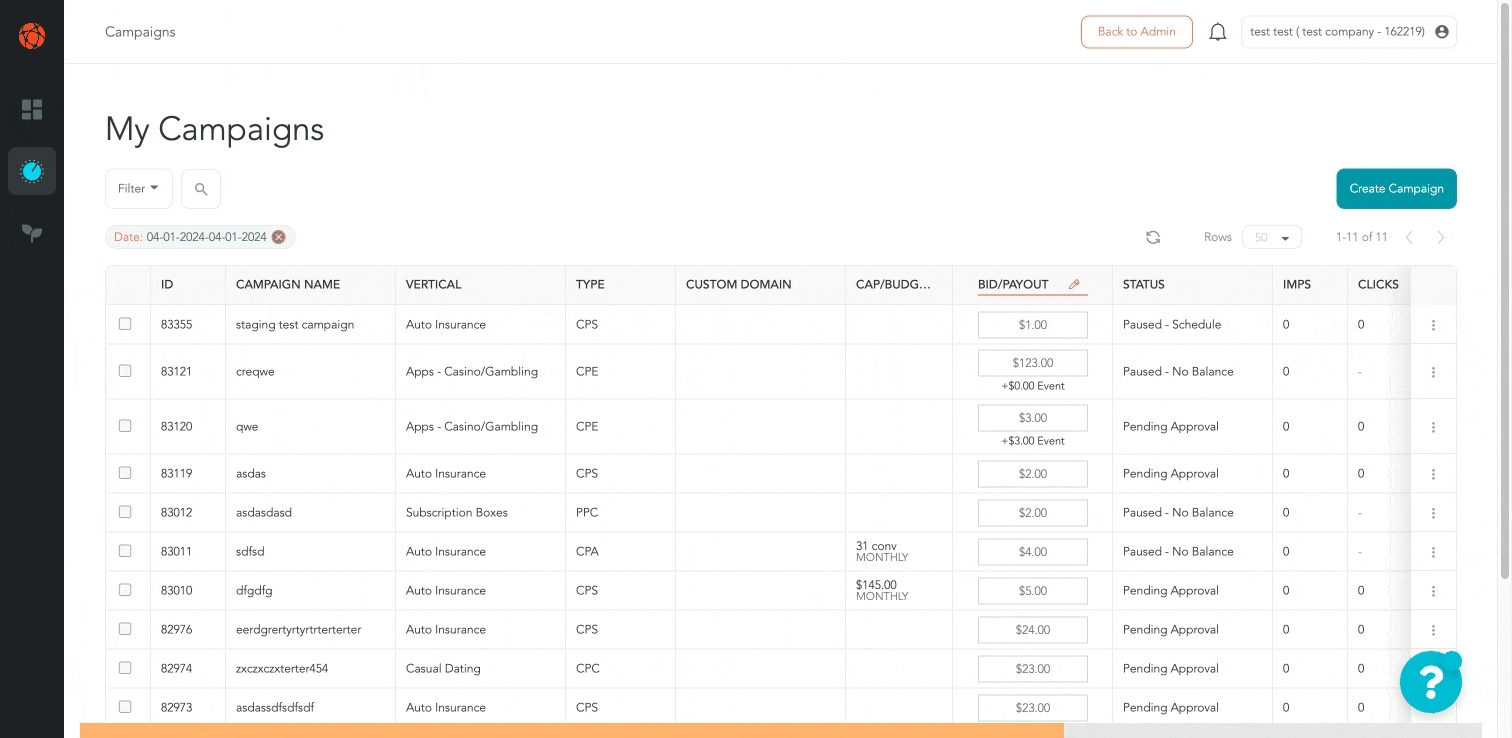
- Navigate to the My Campaigns list
- Find the campaign(s)
- Click on the 3 dot menu > select Edit
- Navigate to the Outcome Funnel section
- Add your new event to the Outcome Funnel by selecting the “+”
- Add your Event details
- Save/Submit Changes
Note: If the event is going to be tracked via postback/pixel, navigate to the Tracking Codes section of the campaign builder to pull the Event postback and/or pixel.
If the quality data being shared is the Sale Amount, the best way to provide this data is as a macro in the postback/pixel. Sale Amount is used to calculate ROAS and AOV. Follow the steps below.
- Navigate to the My Campaigns list
- Find the campaign(s)
- Click on the 3 dot menu > select Edit
- Navigate to the Tracking Codes section
- Copy the Postback or iFrame Pixel code
- The &saleamount= parameter will already be included in the code.
- Paste the Postback or iFrame Pixel code into your tracking platform(i.e. Tune, Impact, etc.) and remember to add your Sale Amount macro to the code after &saleamount=

KPI Setup in CAP
The growth manager will add the KPI to one or all of your campaigns in our backend platform.
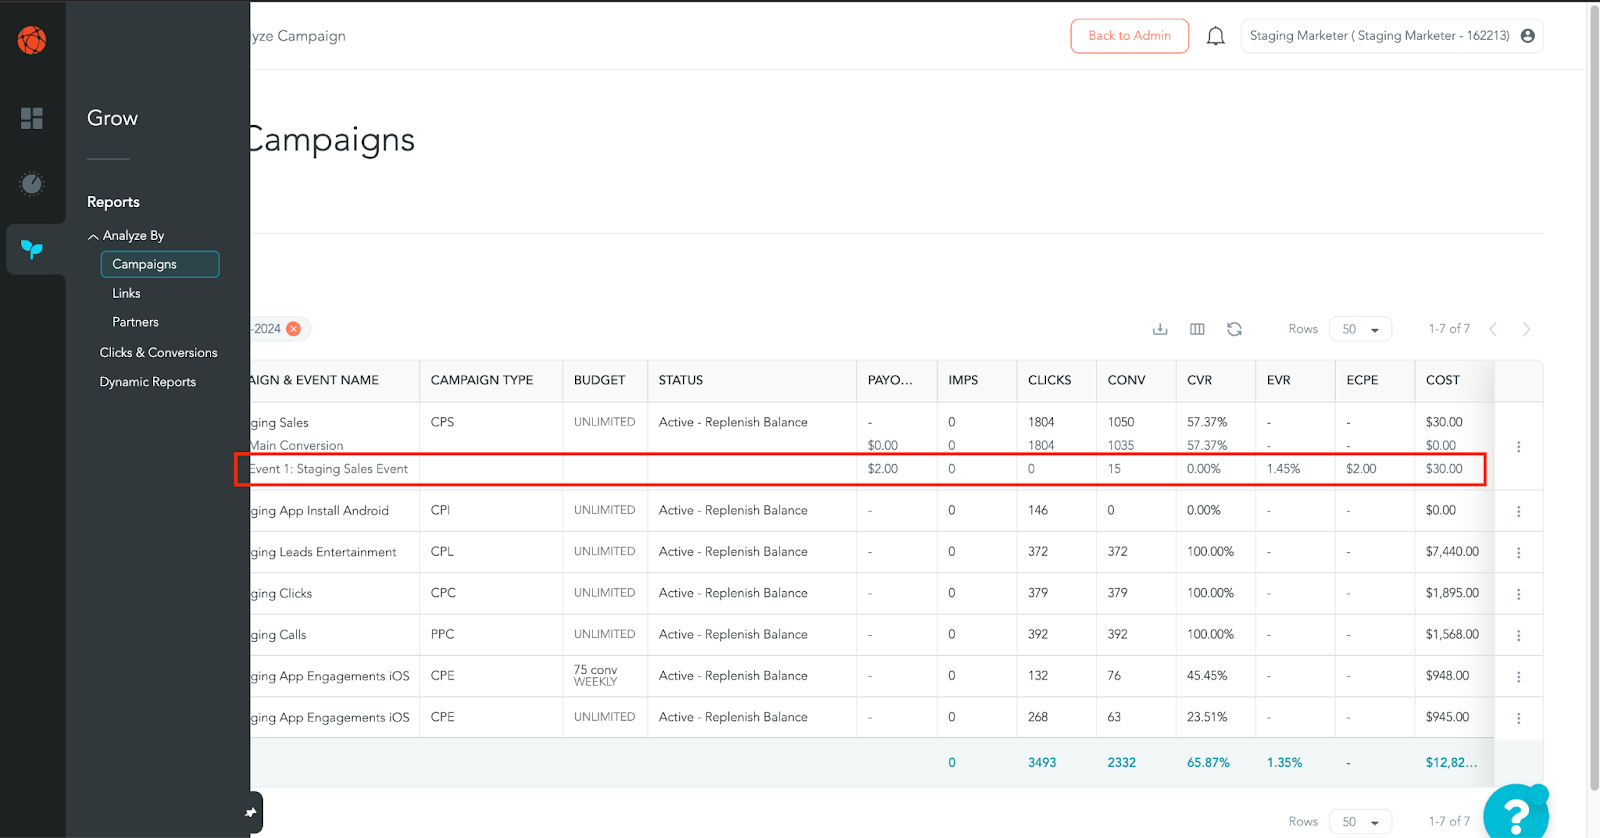
Reporting
In the Marketer UI this quality data is best displayed in the Drilldown Reports (see screenshot below). These Valid Conversions/Events can also be found in the Clicks & Conversions Report and Dynamic Report.
Our internal growth manager team will have even more access to KPIs via our dynamic dashboards and dynamic reporting via our internal Admin UI. KPI data can be analyzed by Partner, SourceID, SubID, or Traffic Type.
Future Build
As we drive marketers to pass us back multiple events and quality data, we will add more KPI visibility to the dashboard and reports.